
Cart is empty.
Item Quantity Price Total: $0

8051 Online Debugger Support & Frequently Asked Questions
[1] I'm trying to use the debugger an example program. When I try single stepping over functions, it works twice, then I get an error "!!! E R R O R !!! Can not execute instruction. Board does not reply. Fast Single Step Executing(PC=1134). Please wait..." This single step never completes. Why ?
[2] Does the debugger support PCA Interrupts of tha AT89C51ED2 microcontroller ?
[3] Which memory model of Micro C should I use with 8051 Debugger ?
[4] How does the debugger and an external application share the PC's serial port ?
[5] How should I configure the debugger checkboxes under the Project->Settings window ("Debugger") tab ?
[6] The debugger occupies 2K on board. Does this 2K reside within our MCU's program code, or elsewhere?
[1] I'm trying to use the debugger an example program. When I try single stepping over functions, it works twice, then I get an error "!!! E R R O R !!! Can not execute instruction. Board does not reply. Fast Single Step Executing(PC=1134). Please wait..." This single step never completes. Why ?
P1.5 port pin of 8051 is used by secondary (PIC) processor to change its mode. Hence P1.5 should not be used by user applications except when communicating with the secondary processor to set LCD contrast or PWM output. If P1.5 is cleared for more than 2 seconds it will restart the whole system.
If you put a breakpoint on a line that changes P1.5, you may see the error:
!!! E R R O R !!! Can not execute instruction. Board does not reply.
Fast Single Step Executing(PC=1134). Please wait...
In order to pass through this line, please set a BreakPoint somewhere after this line and use the "Go"
command. Also, this technique will help you skip over through delay(...) ; lines quickly
[2] Does the debugger support PCA Interrupts of tha AT89C51ED2 microcontroller ?
Unfortunately Mini-Max/51-C debugger does not re-vector PCA interrupt.
It re-vectors only
;
; External Interrupt 0
ORG MONITOR+EX0_int
LJMP USERCODE+EX0_int
;
; Timer 0 overflow
ORG MONITOR+T0_int
LJMP USERCODE+T0_int
;
; External Interrupt 1
ORG MONITOR+EX1_int
LJMP USERCODE+EX1_int
;
; Timer 1 overflow
ORG MONITOR+T1_int
LJMP USERCODE+T1_int
;
; USART + SPI Interrupt
ORG MONITOR+USART_int
LJMP USERCODE+USART_int
; Timer 2 Interrupt
ORG MONITOR+T2_int
LJMP T2_ISR
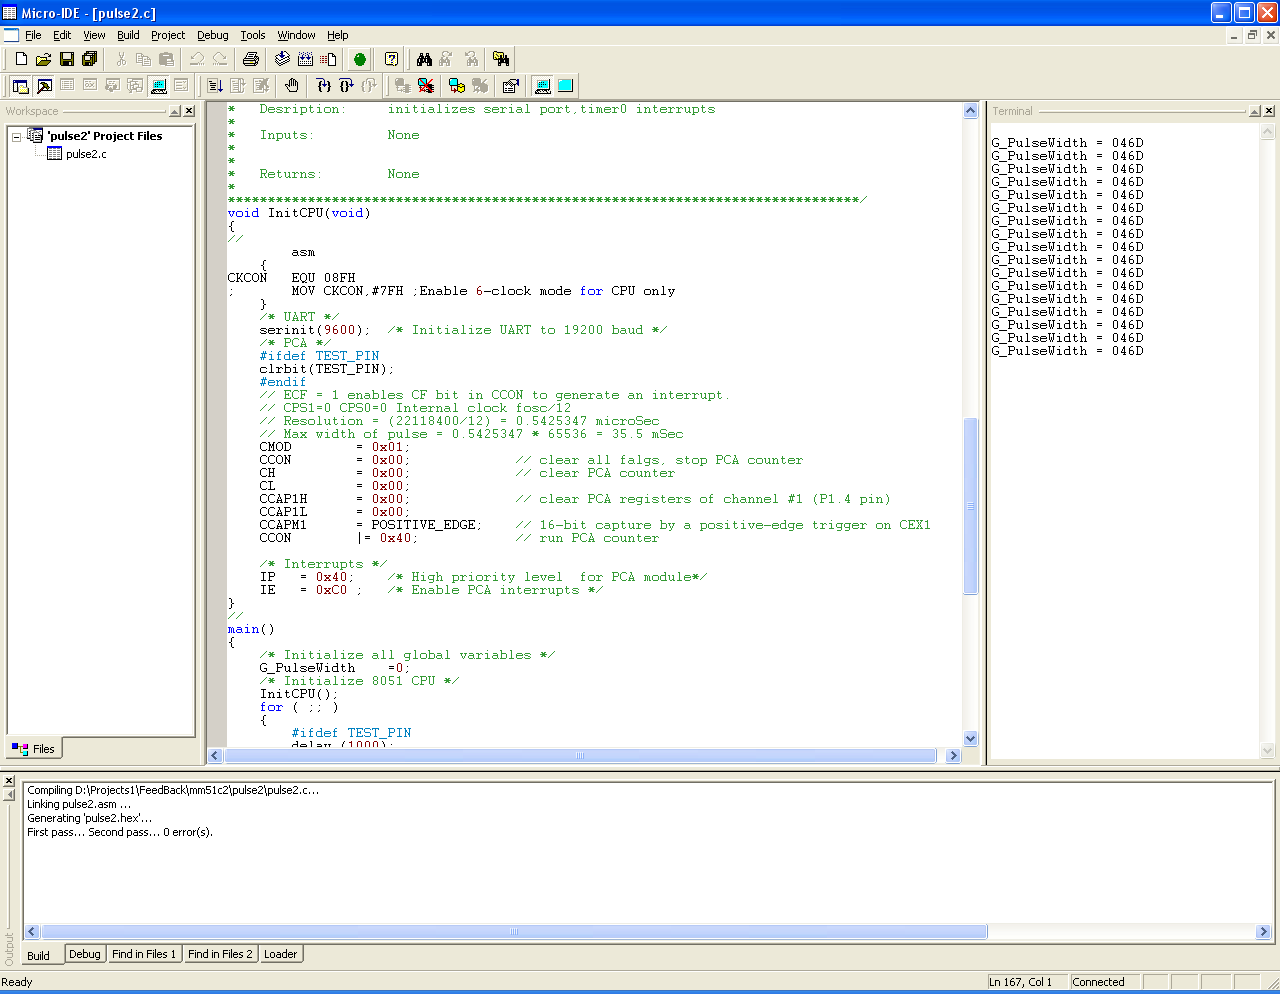
However you can debug PCA interrupts in the terminal window. Please see the Pulse example under \bipom\devtools\MicroC\examples\8051\tiny\pulse.
[3] Which memory model of Micro C should I use with 8051 Debugger ?
We recommend MEDIUM model which is more suitable for AT89C51ED2 if you are using the debugger with our MINI-MAX/51-C2 board. You can use different memory models depending on the requirements of your particular hardware if you are using other boards.
[4] How does the debugger and an external application share the PC's serial port ?
You can not run any external Windows application to send any data to COM port because Micro-IDE occupies this port. In other words, Windows will not return correct handler if your application tries to open the same COM port that the debugger is using. While the debugger is running, you could send data to the 8051 only using the Terminal window of Micro-IDE. To debug your application you can use Micro-IDE terminal window and Go & BreakPoint execution.
[5] How should I configure the debugger checkboxes under the Project->Settings window ("Debugger") tab ?
It shows these checkboxes:
Simulate Interrupts
Simulate Timers
Simulate Serial Ports
Use Hardware Ports in Simulation
All these settings apply only to the 8051 Simulator. Please note that simulation of peripheral modules like Timers,UART, etc. takes some time. In order not to slow execution under the Simulator, you can disable these peripheral modules if you do not use these modules in your program.
"Use Hardware Ports in Simulation" option provides a more realistic environment under 8051 simulator if you already have target hardware. In this case, your 8051 program is still executed as a simulated program but real the port I/O will reflect the correct states of real 8051 port pins.
[6] The debugger occupies 2K on board. Does this 2K reside within our MCU's program code, or elsewhere?
The debugger occupies first 2K of the 8051 program memory. The program memory above the first 2K ( starting at address 0800 hex ) can be used for user programs. If you are programming in Assembly language, start your program using
ORG 0800h
If you are using Micro C, it uses 0800 as default so no action is needed ( unless you have edited the startup libraries yourself to specify a different startup address ).